
The Difference Between Airbnb Income Calculators and Manual Spreadsheets
I used to find comfort in rows and columns. There is a specific satisfaction in building a complex Excel model. You spend hours tweaking macros. You link cells across tabs.
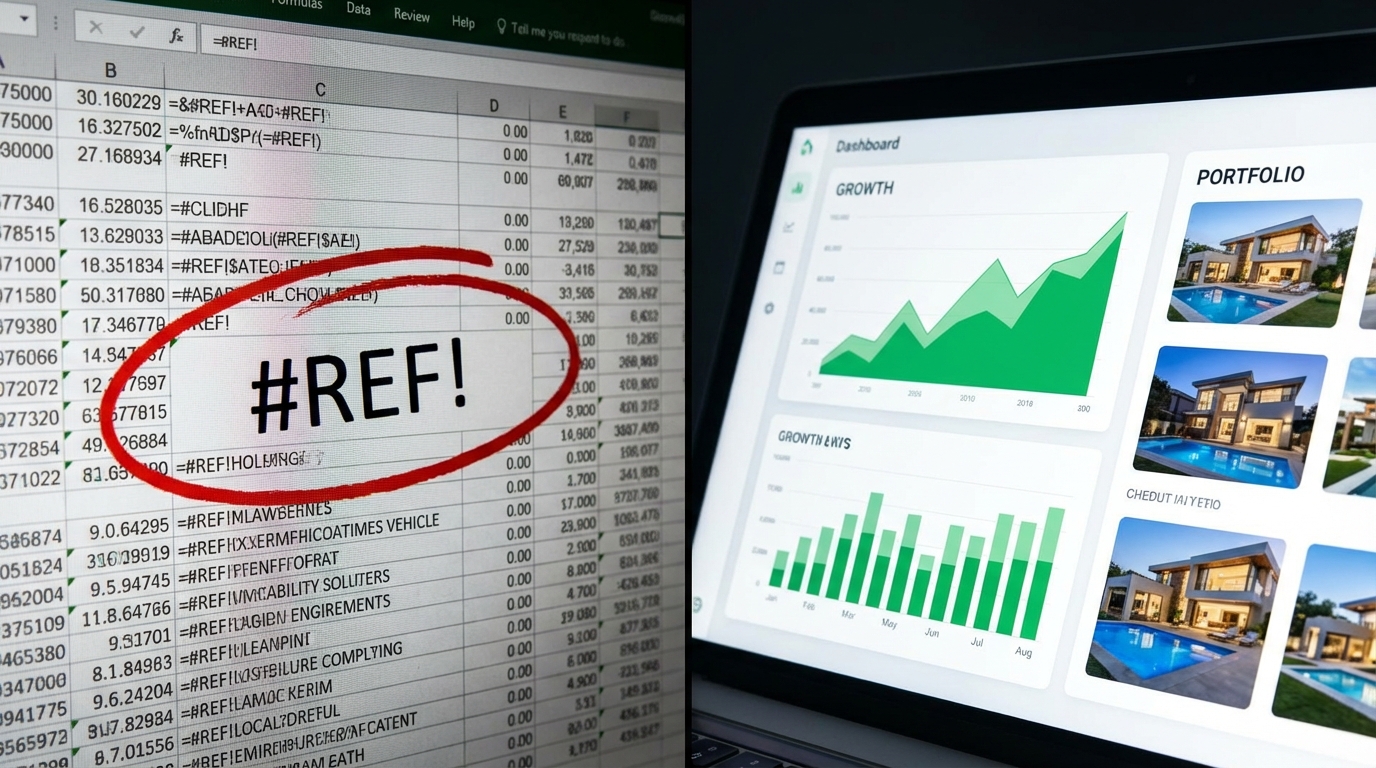
I used to find comfort in rows and columns. There is a specific satisfaction in building a complex Excel model. You spend hours tweaking macros. You link cells across tabs. You verify the formulas. It feels like control. It feels like you have wrapped your arms around the market and forced it into a logical grid.
I was wrong. That feeling of control is an illusion.
I have audited hundreds of investment strategies over the years. I see agents presenting pro formas built on “napkin math” or legacy Excel templates they downloaded five years ago. They trust these tools implicitly. They bet their clients’ capital on them.
This trust is misplaced.
Research reveals a terrifying reality for anyone managing money. 88% of spreadsheets contain significant errors. That is not a typo. Nearly nine out of ten manual models have mistakes hardcoded into them. These aren’t just formatting issues. They are calculation errors, broken links, and outdated assumptions.
Think about what that means for a real estate transaction. You are advising a client to drop six or seven figures on a property. You base your advice on a tool that has an 88% chance of being wrong.
I decided to stop gambling. I realized that manual entry was the single biggest risk in my business. Why Income Calculators Can Save You Thousands explains this in detail, but the short version is simple: accuracy is the only thing that matters.
The High Price of ‘Free’ Tools: Manual Spreadsheets vs. Market Reality
Most agents stick to manual spreadsheets because they are free. They are accessible. Everyone has Excel. But “free” is often the most expensive price tier in existence.
There is a principle in data quality management that explains why. It is called the 1-10-100 Rule.
The concept is straightforward. It costs $1 to verify a record at the point of entry. It costs $10 to correct it once it is in the system. But if you fail to catch that error and let it drive a business decision, the cost balloons to $100.
In rental property analysis, that “$100” cost isn’t literal. It represents lost equity. It represents a property that sits vacant because the projected nightly rate was $50 too high. It represents a client who buys a money pit because the maintenance formula was broken.
The market punishes inaccuracy. Data from The Warren Group shows that accurately priced homes sell 50% faster. The inverse is also true. Bad data leads to bad pricing. Bad pricing leads to stale listings. Stale listings lead to price cuts that far exceed the cost of a proper software subscription.
Static sheets fail because the market is dynamic. You might build the perfect spreadsheet on January 1st. By March, a major employer might relocate. Migration patterns shift. Seasonality kicks in. Your spreadsheet stays frozen in January. It does not know the world changed. It continues to churn out advice based on old news.
The Solution: Dynamic Rental Property Forecasts
I needed a tool that lived in the present. I needed something that pulled live data rather than relying on my memory or manual inputs. This is why I switched to Rental Forecast®.
The difference is night and day. A spreadsheet asks you to guess the occupancy rate. You might type “65%” because that sounds reasonable.
Rental Forecast® does not ask you to guess. It looks at the rental property forecast based on actual activity. It scans the immediate 1-2 mile radius of the subject property. It identifies comparable short-term rentals. It sees their real calendars. It sees what they actually charge per night, not what they hope to charge.
This is the difference between a hypothesis and a field report.
The tool aggregates this data. It adjusts for seasonality automatically. It shows you the high season and the low season. It gives you a revenue projection based on market evidence.
It removes the user error. I no longer worry if I broke a formula in cell C45. I don’t have to check if my sum range includes the new row I added. The system handles the logic. I handle the strategy.
Underwriting with Institutional Precision: The Airbnb Income Calculator
We need to talk about specific features. General data is good, but specific underwriting wins deals. The Airbnb income calculator inside this platform allows me to model a deal with the same precision as an institutional investor.
Spreadsheets often gloss over expenses. They use a flat percentage for “operations” and call it a day. That is lazy underwriting. It leads to negative cash flow surprises.
Here is how I use the tool to get granular:
- Interactive Expense Modeling: I don’t guess the taxes. I input the actual tax rate. I add the specific HOA fees. I include the estimated utilities based on square footage. The calculator subtracts these real costs from the dynamic revenue data. I get a true Net Operating Income (NOI).
- Break-Even Analysis: This is the most powerful conversation starter I have. The tool calculates exactly what occupancy rate we need to cover all costs. If the break-even is 30% and the neighborhood average is 65%, the client feels safe. If the break-even is 80%, we walk away.
- Custom Projections: I can toggle between conservative and aggressive scenarios. I show the client the “worst case” and the “likely case.”
For a deeper dive on how this specific calculation impacts your bottom line, check out our field note on the Airbnb Income Calculator for Realtors.
The Definitive Artifact: Building Trust Through Reporting
There is a moment in every consultation that defines the relationship. It is the moment you hand over the analysis.
In the old days, I handed over a printed Excel grid. It was cluttered. It was hard to read. It looked like homework. Clients would squint at it. They would ask what “Sheet1!REF#” meant. It didn’t inspire confidence.
Now, I hand them a white-labeled PDF report generated by our real estate tools.
It is clean. It features the property photo on the cover. It highlights the Cash on Cash Return, Cap Rate, and Monthly Cash Flow in large, clear typography. It visualizes the seasonality with bar charts.
This document is the “Definitive Artifact.”
It signals that I have done the work. It proves I have access to data they do not. It positions me as a consultant, not just a door opener.
Investors rely on data to make decisions. When you present that data in a format that looks like a Wall Street prospectus, you bypass their skepticism. They stop questioning your math and start discussing the offer price.
The Institutional Pivot: From Analysis to Execution
Great analysis is useless without execution. This is where we pivot from being a user of a tool to being a provider of a solution.
Automation and data are the entry points. The goal is to get the deal done.
Once Rental Forecast® validates the numbers, we trigger the KW Rental Investments ecosystem. We don’t just say “good luck.” We provide the path forward.
- Financing: The income report we generated is not just for the client. Lenders need it too. We partner with CMG Home Loans for Strategic Investment Financing & Advisory. They can use the projected income (DSCR loans) to qualify the borrower. The report validates the loan.
- Protection: High returns create liability. We connect the client to KKOS Lawyers. They handle the Asset Protection & LLC Formation. They ensure the structure matches the strategy.
- Setup: The numbers assume the house is rent-ready. We ensure it is. We provide Rental Essentials Lists. We tell the client exactly what to buy to achieve the nightly rates we promised.
Conclusion: The Professional Standard
Real estate is evolving. The days of gut feelings and back-of-the-napkin math are over. The margins are too tight, and the stakes are too high.
Your clients deserve more than a guess. They deserve data.
I traded my spreadsheet for Rental Forecast® because I could no longer justify the risk of manual error. I wanted to sleep at night knowing my advice was backed by the market, not a broken formula.
If you want to be the go-to expert in your market, you have to stop using amateur tools. Adopt the professional standard. Protect your client’s capital. Build your reputation on precision.
Not sure which strategy fits?
Take the investor quiz and get pointed toward the rental strategy that matches your goals — then talk it through with a KW agent who invests for a living.